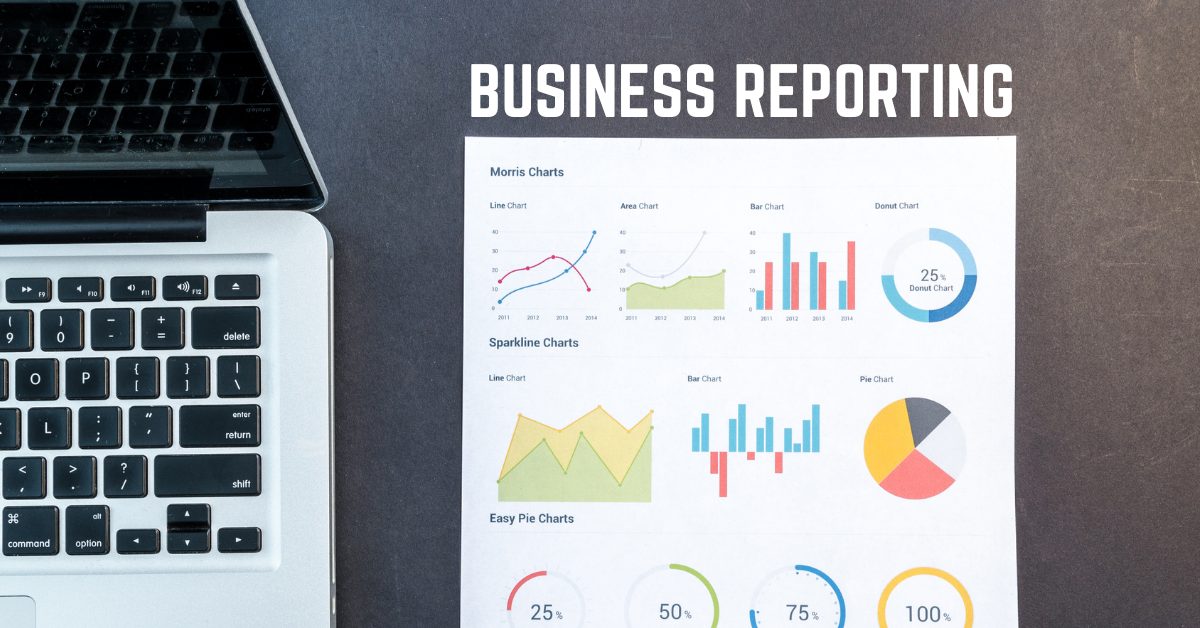
Business reporting has the potential to drive business growth by helping you make more informed management decisions. It is the foundation for data dashboards that lead to more predictive data analysis. So, here we have mentioned 8 steps to create an efficient data dashboard for your business.
How will a data dashboard help my business?
Data dashboards help you capture and record specific points for each operation and business function. It helps the management gauge the overall performance of the organization.
Efficient data dashboards provide a clear and concise real-time update of the key performance indicators of any business.
An efficient dashboard provides data visualization of the key metrics, giving you the ability to identify and correct negative trends encountered. Eventually, this makes business reporting a key element to measure efficiency and overall performance.
What is Business Reporting?
Business reporting gives you the ability to generate detailed reports to help you make informed decisions based on the collected business intelligence. In other words, this leads to the strategic alignment of organizational goals.
Business reporting provides instant visibility to all systems in real-time. For instance, this helps in the quick identification of data outliers and correlations, which can be processed. Data dashboard transforms information that is easy to interpret and read without a detailed explanation. As a result, critical information on key metrics is highlighted in a visual format.
7 Steps to create an efficient data dashboard:
- Determine what is to be included in the dashboard for evaluating critical metrics.
- Incorporate key performance indicators to improve operational strategy.
- Identify key strategic goals to evaluate business direction.
- Incorporate key risks and opportunities such as accreditation and forecast in business reporting.
- Create data dashboards at multiple levels across the enterprise.
- Collect and input all metrics for all the business functions.
- Filter all the data to highlight growth and incentive metrics for employees and vendors.
Conclusion
Dashboard reporting helps business owners and managers to improve their decision-making process. As a result, it helps to increase their business performance and drives growth.